

While working in Databricks, I needed to plot some images. I wrote some code that does this in IPython notebooks, but I need something that works on a dataframe. I decided to change the code a bit, so it works in Spark / Databricks. This solution uses PIL and Matplotlib.
Display Images utility function
The input is a dataframe that has a url and a title column. We download the URL and plot it in the final image:
import matplotlib.pyplot as plt
import requests
from PIL import Image

n = __builtins__

def display_images(
  images_df,
  columns=5, width=20, height=8,
  max_images=3*5, label_font_size=8):

  cnt = images_df.count()
  if cnt == 0:
    print("No images to display.")
    return

  if cnt > max_images:
    print(f"Showing {max_images} images of {cnt}:")

  rows = images_df.limit(max_images).select("url", "title").collect()
  height = n.max(height, int(cnt/columns) * height)
  plt.figure(figsize=(width, height))

  for i, row in enumerate(rows):
    stream = requests.get(row.url, stream=True).raw
    with Image.open(stream) as image:
      plt.subplot(int(cnt / columns + 1), columns, i + 1)
      plt.imshow(image)
      plt.title(row.title, fontsize=label_font_size);
I've added some parameters to influence the rendering:
columns- the number of columns used for the thumbnails. Default is 5 images.width- the width of the thumbnail in inches 🤦height- the height of the thumbnail in inches 🤦max_images- the number of images to plot, 15 by default (that's 3 rows).label_font_size- font size of the label in points 🤦
Let's plot some Lego boxes
Let's download some Lego product images from the Wehkamp site:
from pyspark.sql import *
from pyspark.sql.functions import *
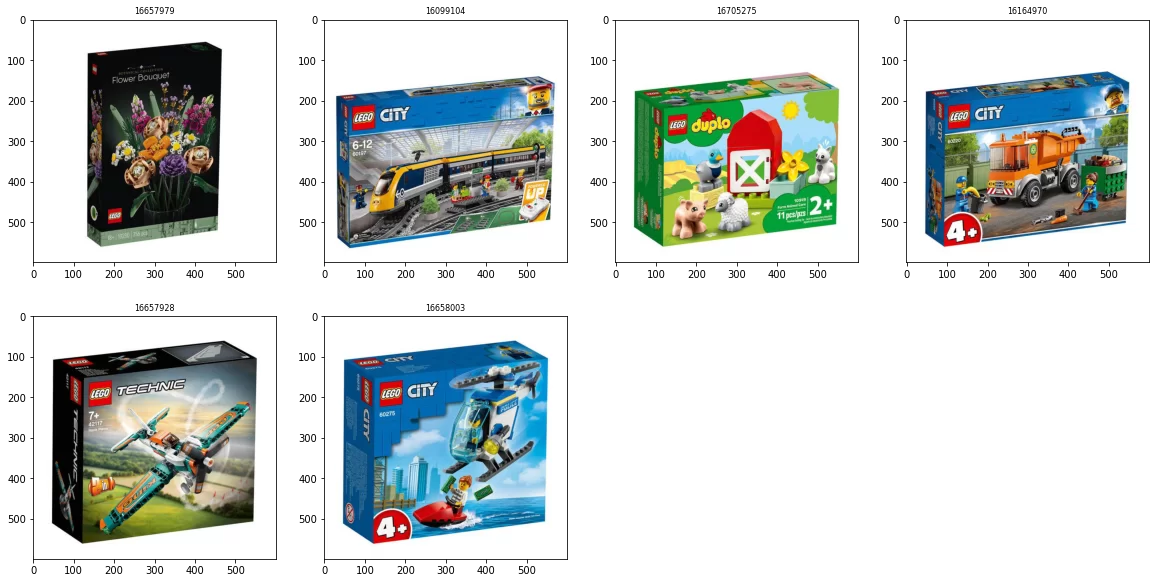
articles = ['16657979', '16099104', '16705275', '16164970', '16657928', '16658003']
url = format_string('https://images.wehkamp.nl/i/wehkamp/%s_pb_01/?w=600&qlt=75', 'article_id')
articles_df = (spark
.createDataFrame([Row(article_id=a) for a in articles])
.withColumn("url", url)
.withColumnRenamed("article_id", "title"))
Now if we want to display them, we simply do:
display_images(articles_df, columns=4, height=10)This results in:
Final thoughts
This code can give you a nice overview of what's going on, but it won't work on huge amount of images. It helps to visualize smaller data sets.