

At the Wehkamp Tech Hub, we support Wehkamp with technology in the broadest sense of the word: almost everything is technology. Larger initiatives, like the replacement of our order management system, require careful planning across teams; we have many initiatives like that.
When I walk into the office of my boss, Jon Higgins (CTO), I'm greeted by a huge planning wall. It feels a bit like one of those large charts the British Navy used in World War II to plan operations and track the current situation. While I love the clarity it provides, it also saddens my IT heart a little: shouldn't we be able to create something digital? If it were up to me, I'd replace the entire wall with a full-touch LED panel.
Our former Head of Product, Sander Hoekman, also wanted to share more of the roadmap with the organization, so he asked me to look into generating a roadmap report that we could share more broadly.
What did it used to look like?
Céleste, one of our Product Owners, did some digging and found an early version of the planning wall from 2023:
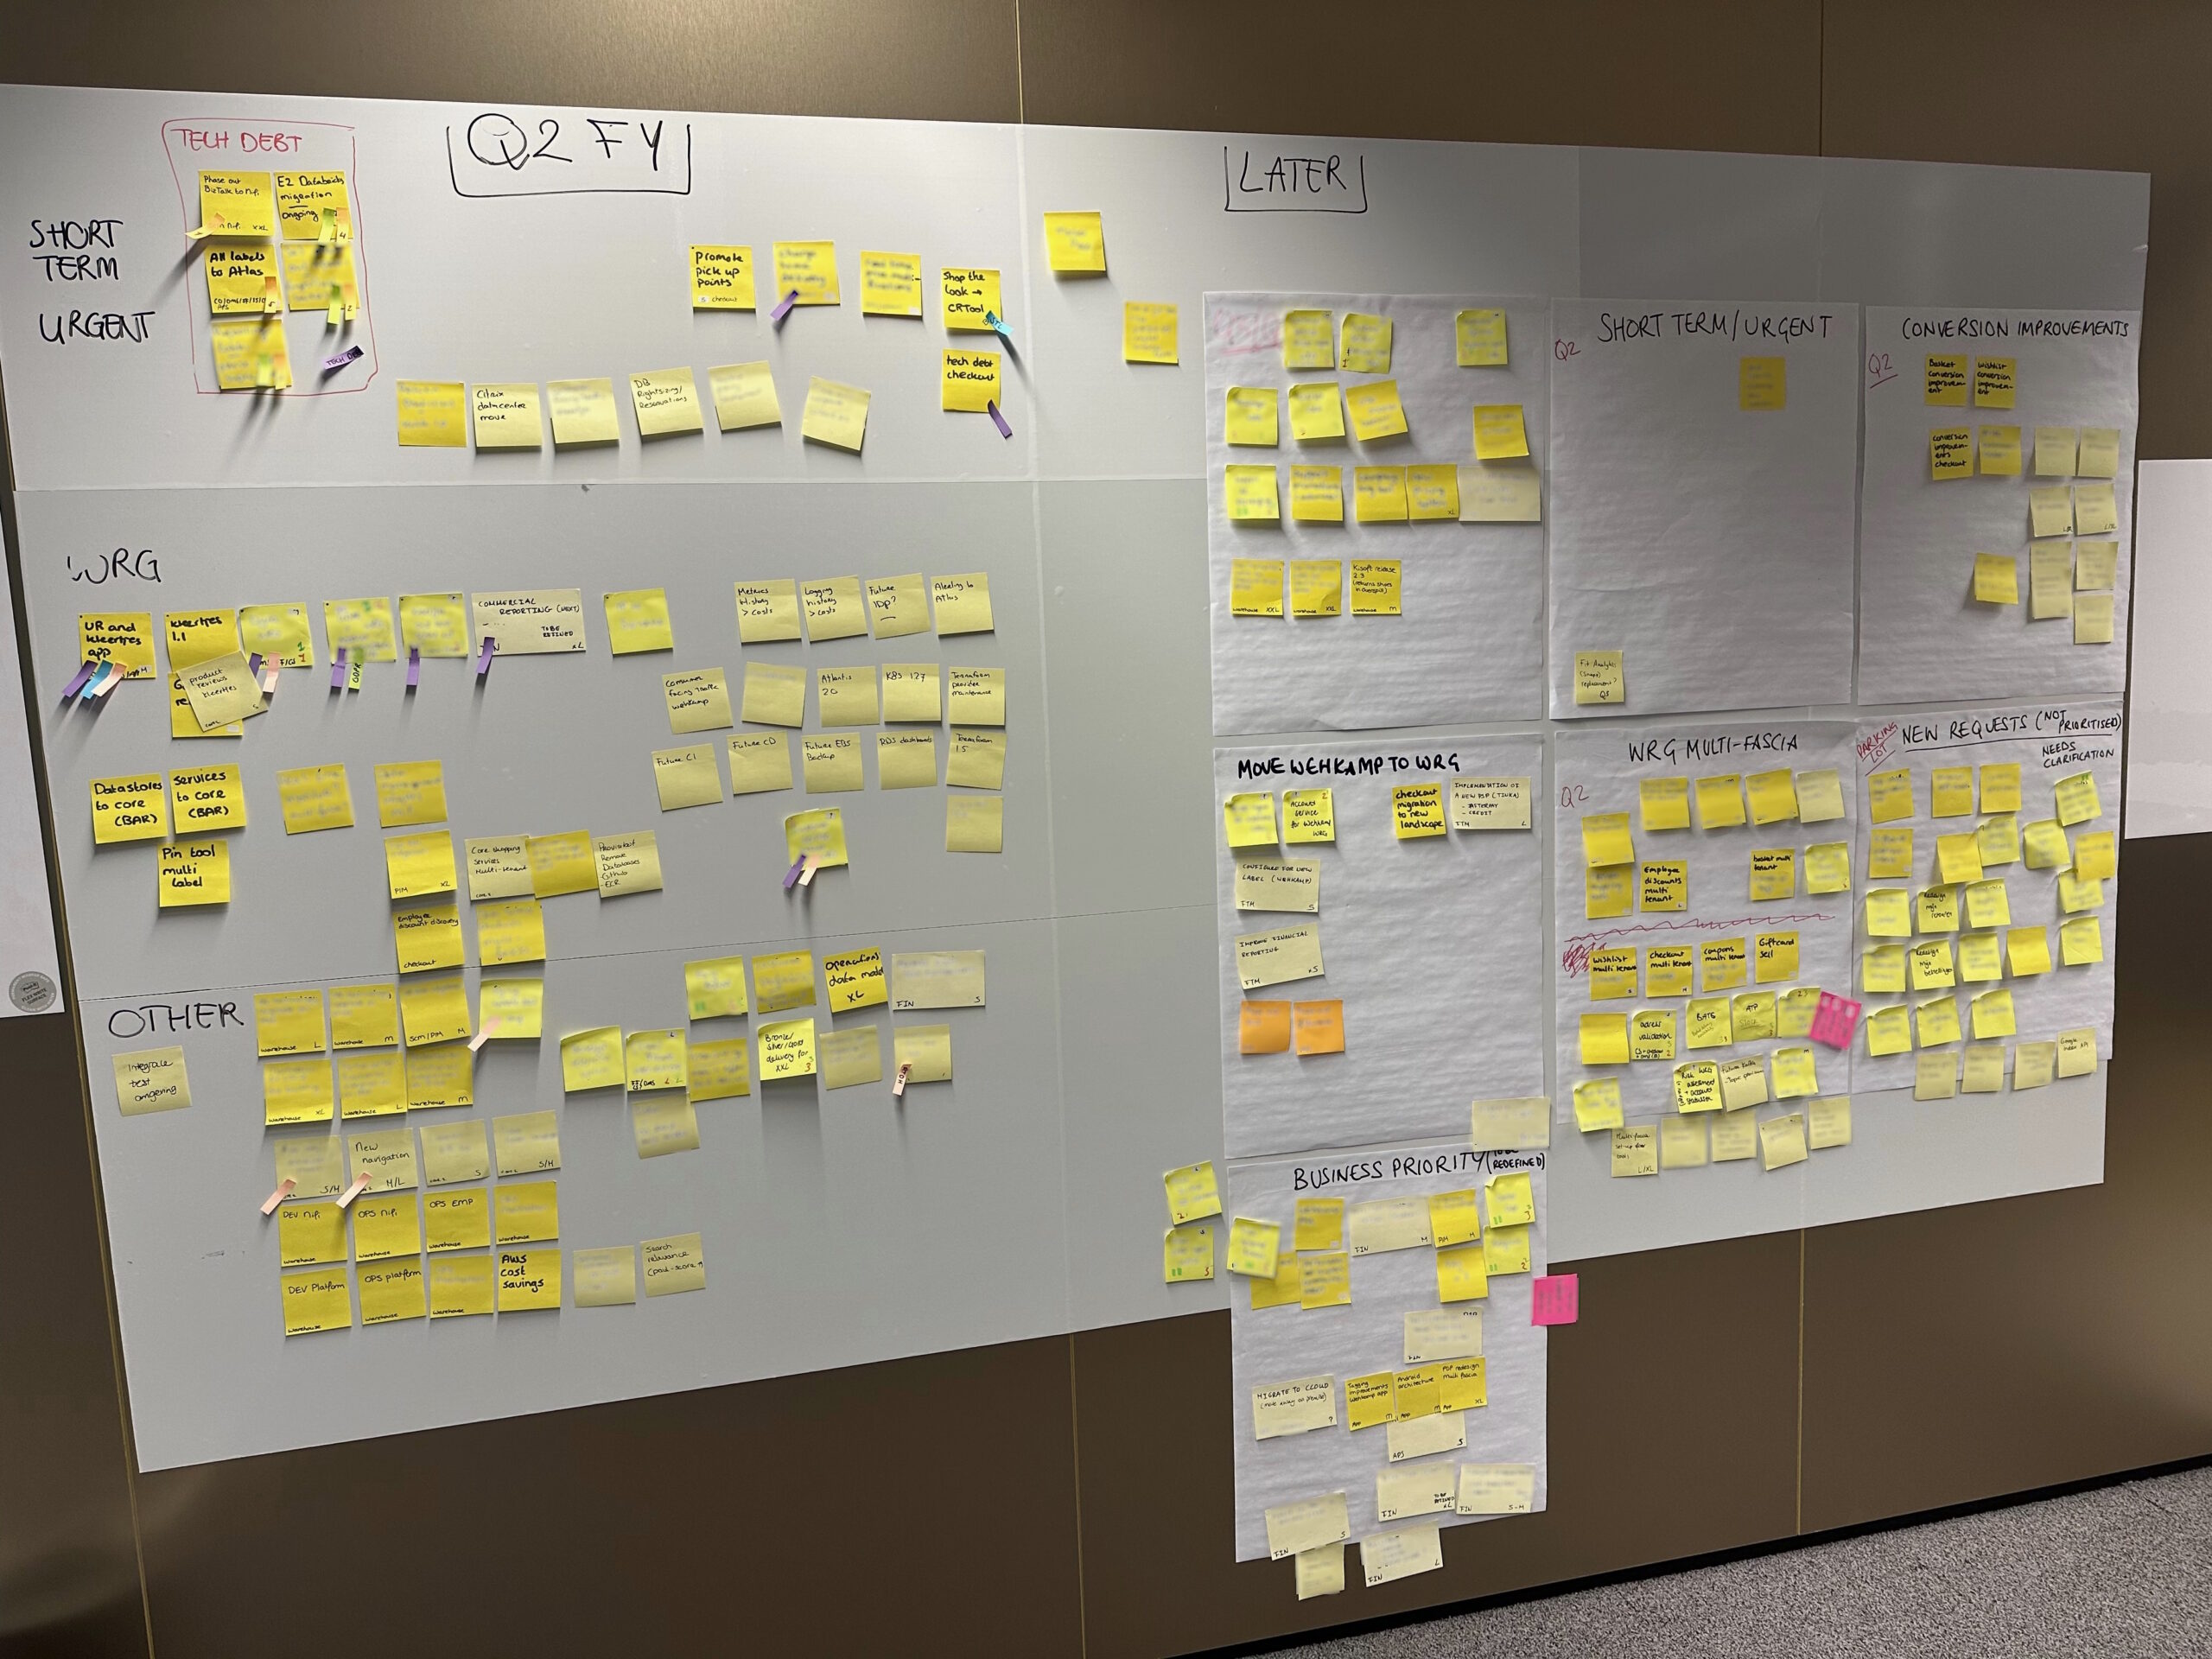
Later versions of the wall tried to plan further ahead. Unfortunately, I wasn't able to find a more recent wall with stickies, so this is what we could come up with:
Goals of the project
I like solving multiple problems at once, so I wasn't going to build just a report, but a tool that would give our organization insight into the roadmap. First, we needed to lay the groundwork by defining the requirements:
- The data will always live within Jira
The tool will be a read-only view on top of the current state in Jira Advanced Planning (with some caching for performance). - Reports will be generated from the tool
There was a need for a PDF report, but it usually ended up in a Google Slides presentation, often as a low-resolution screenshot. To address this, we'll generate full-HD slides that can be added as images. - Give more attention to non-functional
programs
Technical programs should be included in the roadmap, as they impact teams and availability. - Give more insight into the complexity
of a milestone
When multiple teams are working on the same topic, it is likely to be complex. Let's show a list of teams that are working on a milestone. This will also give us insight into which team or teams might become a bottleneck because of their workload. - Help tech leadership
Which topics are late? Which topics have been replanned? Which topics are being investigated? The roadmap should give leadership useful input for their weekly meetings. - Access
Not everyone has access to Jira, so let's give our stakeholders access to this tool so they know what is being worked on and what is coming up.
What's the (Jira) Plan?
Due to the nature of the topics we work on, we use many approaches at the team level. The replacement of our VMware cluster or a network component is a project that follows a waterfall approach with clearly defined phases. A redesign of our branding is typically a multi-team effort that uses agile (Scrum or Kanban). No matter the approach, all of these topics need to be weighed, planned, and discussed. That's where our roadmap comes in.
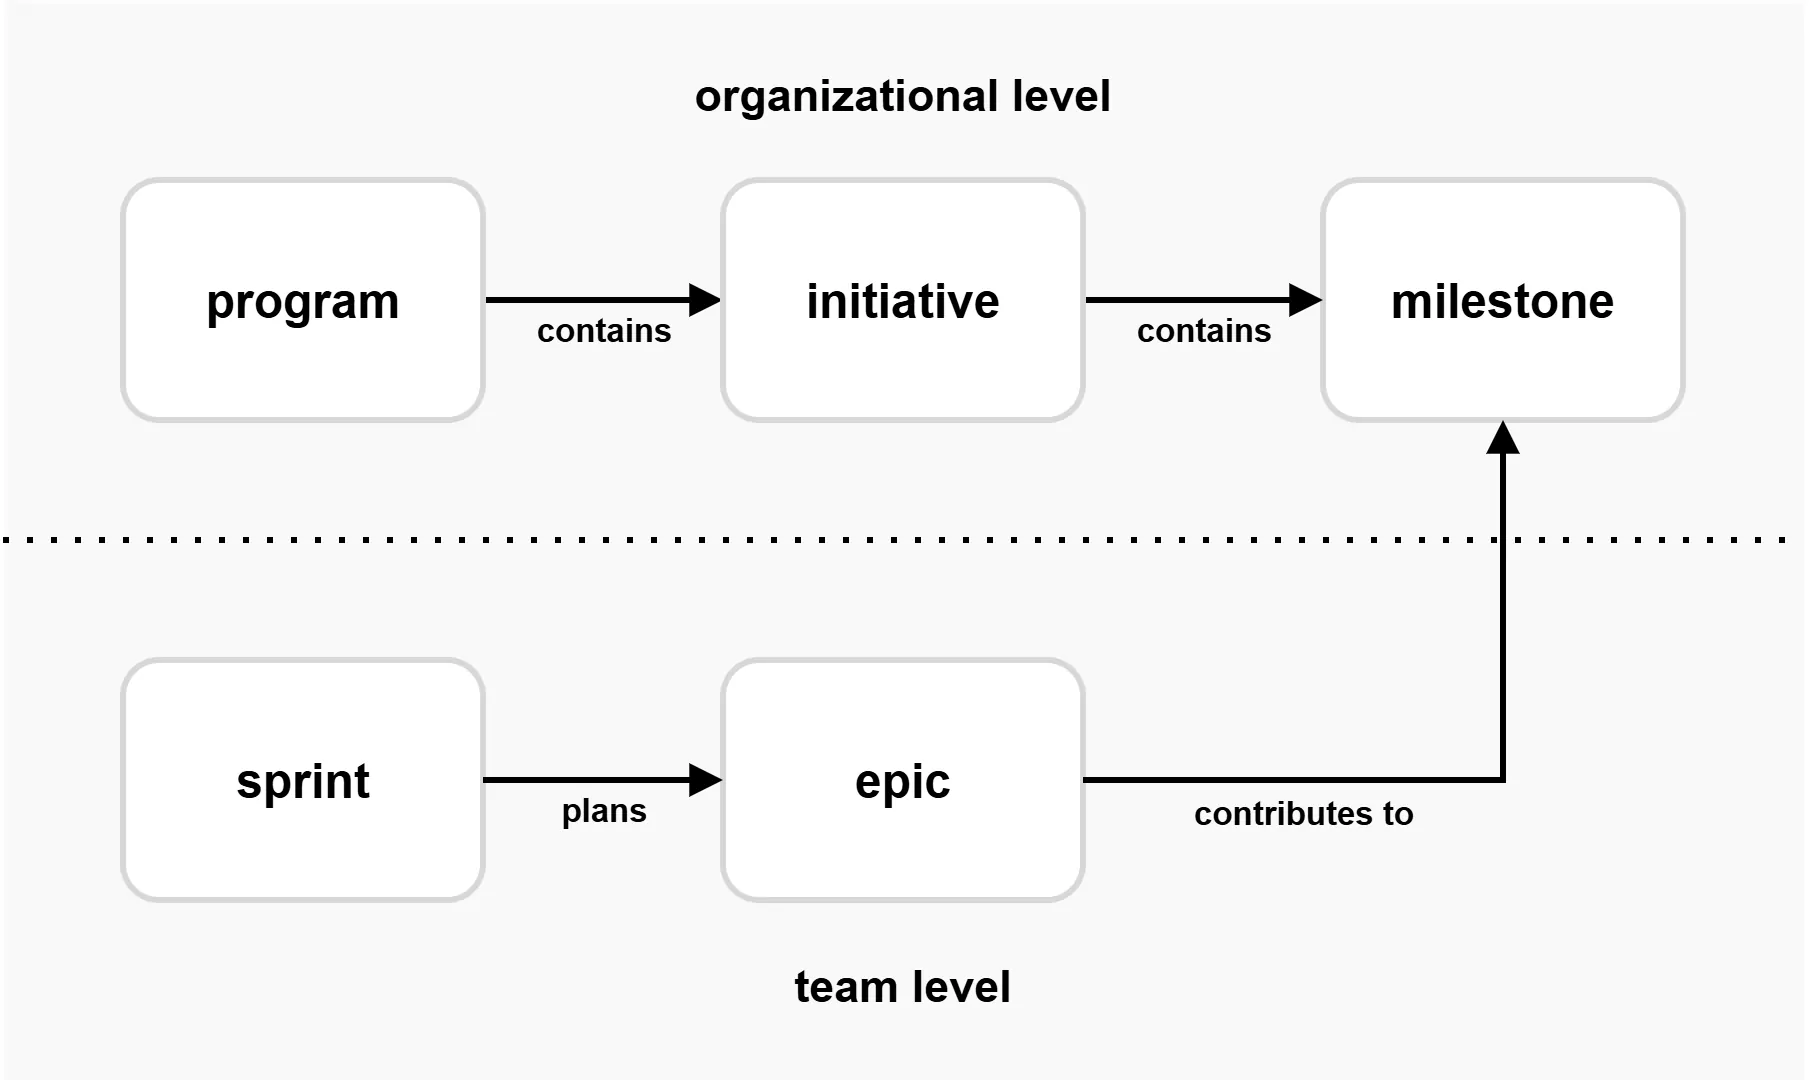
When moving away from our on-premises Jira server to SaaS, we knew we wanted to invest in Jira Advanced Planning. We wanted to be able to give an overview of our topics, plan them, and visualize the roadmap. We also wanted to separate long-term planning from team planning (agile and on a per-sprint basis).
So we came up with the following structure:
It took some time to set it up, but we had some useful overviews almost overnight. While this was a good improvement, we still lacked a few features:
- Which teams are actually working on which roadmap topics?
- How can we give non-technical people access to our roadmap without them having access to Jira?
- How can we be transparent about what we replan ? Plans are never static in the real world!
- How can we export our charts to be part of our regular update presentations?
- Personal: how can I build something that can compete with "the wall"?
What did we come up with?
Without going into too many technical details, we used the following technology stack:
- We use Istio + Dex + OAuth2 Proxy + Google login to give our Wehkamp users access to our application.
- A small Node.js container that fetches the data from Jira.
- A fast single page application that allows users to interact with the data.
- Some clever CSS to plot our milestones and progress bars in the right position on the calendar.
- The excellent HTML to Image library to generate the full-HD slides.
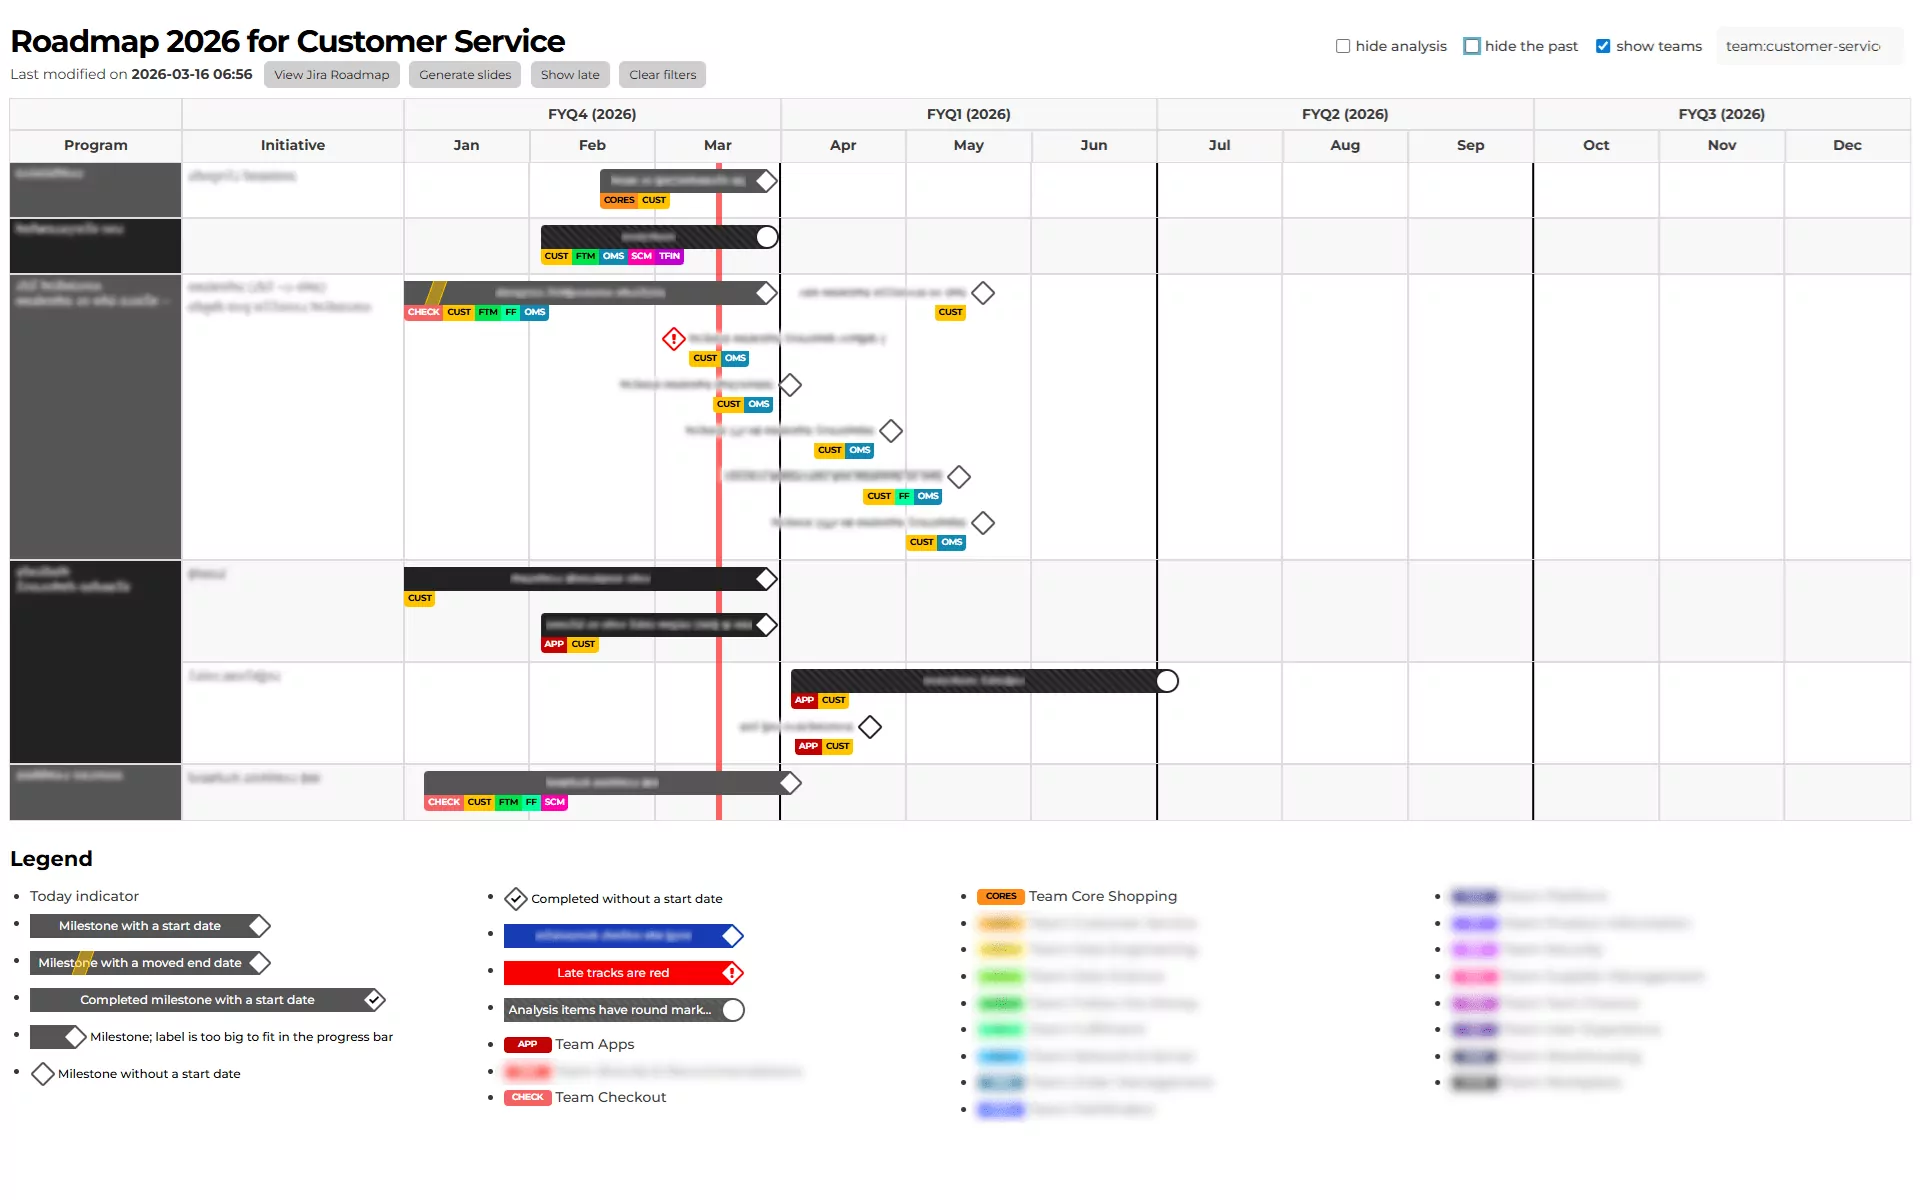
For obvious reasons, I cannot share the full Wehkamp roadmap, but I can blur the topics and show a single team. Here you can see what the customer service team is working on:
Acknowledgments
Many thanks to Sander Hoekman, Céleste Polstra, Vincent Wolff, Bart Jansen, and Lisette Berghuis for collaborating on this tool and on implementing the roadmap across the organization.