

At Wehkamp, we use the Hubot Grafana project to make our Grafana dashboard available in Slack. It mainly helps our standby team to make quick assessments on what's going on with our website. Last year, we saw we could not upgrade the package from 2.5.2 to 3.0.1, because slugs could not be used anymore. But we use slugs and... quite heavily! So we did not upgrade our Grafana v7... until we got hit by the input field bug. We decided to see what we could do to bring our slug feature back to our ChatOps bot!
A big shout-out to Kees Duvekot, Niek Rosink and Chris Vahl for the collaboration on the Grafana v9 upgrade.
At Wehkamp we use bot-zero, a Hubot project that has its CoffeeScript removed in favor of TypeScript. Hence, the code in this blog is written in TypeScript. A "normal" Hubot understands JavaScript, so it should not be hard to convert the code to JavaScript and add it to your Hubot instance.
The initial article was written in 2022 and things have evolved a bit. I've added some of the code of the earlier article to the hubot-grafana package, so the article now uses the code provided by the package.
No slug, but we have a URL
Grafana provides a nice search API that can search for dashboards. Let's see what it returns:
{
  id: 904,
  uid: 'ICRkSGv4k',
  title: '[Team tooling] consumer-gateway - Nginx metrics (nl.wehkamp.prod)',
  uri: 'db/team-tooling-consumer-gateway-nginx-metrics-nl-wehkamp-prod',
  url: '/d/ICRkSGv4k/team-tooling-consumer-gateway-nginx-metrics-nl-wehkamp-prod',
  slug: '',
  type: 'dash-db',
  tags: [ 'nl.wehkamp', 'prod', 'tooling' ],
  isStarred: false,
  sortMeta: 0
}
I see two fields that are very similar to my old slug field: uri and url. When you read the docs, you'll see that the uri field is deprecated since Grafana v5.0. So we might get somewhere by parsing the url field.
You might say: why not switch to UID, as Grafana advices you to do? Well... our dashboard generator setup contains a bug which generates a new UID once in a while, but the name and URI are fairly constant. Also: it is nice to have a human readable string.
Make Hubot understand
Let's alter the message before it reaches the Hubot Grafana package. We can do this by using the Hubot Receive Middleware API; this API makes it easy to alter the text of a message (we've used the same technique to remove markdown from incoming Slack messages). Note: the Hubot middleware was rewritten in modern versions of Hubot. My code uses the newer async middleware.
Let's match messages that are for Grafana dashboards, extract the old slug and see if we can come up with a matching UID. If we can find such an ID, we use it to alter the message, otherwise we let Hubot Grafana have the original message.
Here is the code:
import { Bot } from "hubot-grafana/src/Bot"

function parseGrafanaSlugs(robot: Hubot.Robot) {
  if (!robot) throw "Argument 'robot' is empty."

  const bot = new Bot(robot)
  const dashboardRequestRegex = /(grafana|graph|graf) (dash|dashboard|db) ([^ :]+)/i

  robot.receiveMiddleware(async context => {
    const text = context.response.message.text

    const match = dashboardRequestRegex.exec(text)
    if (match) {
      let dashboardId = match[3]
      let uid = null

      try {
        uid = await bot.createService(context.response).getUidBySlug(dashboardId)
      } catch (ex) {
        robot.logger.error("Error finding dashboard", ex)
      }

      if (uid) {
        const newText = text.replace(dashboardRequestRegex, "graf db " + uid)
        robot.logger.info(`Changing "${text}" to "${newText}".`)
        context.response.message.text = newText
      }
    }

    return true
  })
}

module.exports = (robot: Hubot.Robot) => parseGrafanaSlugs(robot)
When we add this middleware, our Hubot logs:
INFO Changing "jarvis graf db team-tooling-consumer-gateway-nginx-metrics-nl-wehkamp-prod:1 now-6h now" to "jarvis graf db ICRkSGv4k:1 now-6h now".🎉 Hurray! 🎉
You might want to load your middleware a bit late(r)
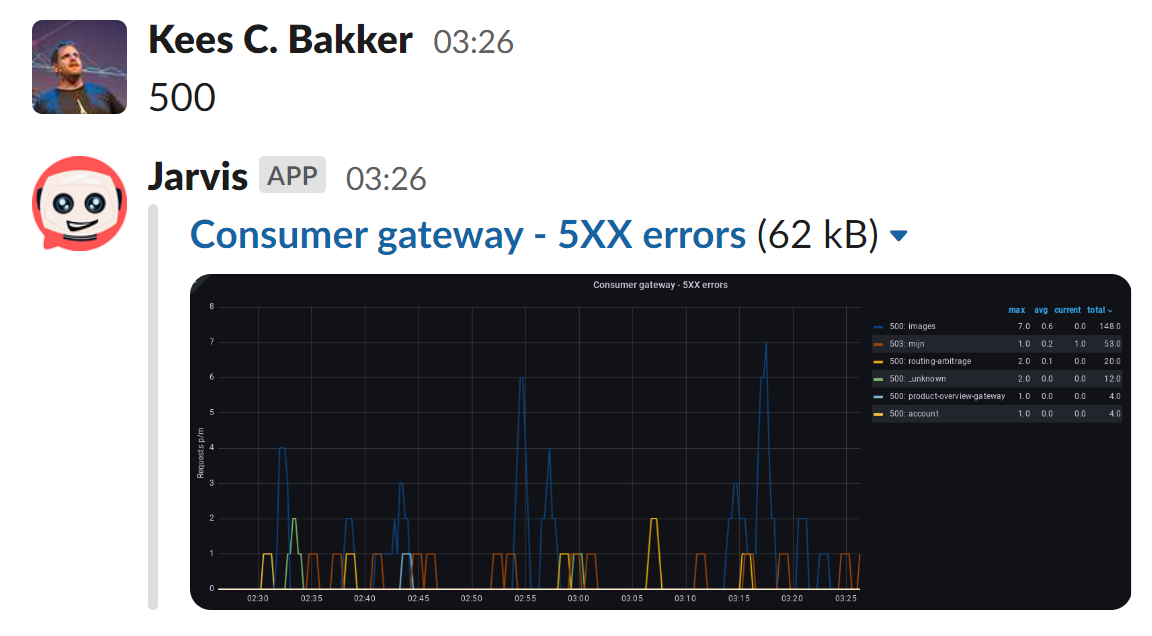
Our code uses the Hubot Command Mapper Alias feature to turn complex Grafana commands into simple ones, like @jarvis 500 -- which will return a dashboard on all the HTTP 500 responses of wehkamp.nl. Be careful with the order, we needed to add our aliases to _alias.ts and our Grafana script to _grafana-slugs.ts. This makes sure both the alias and the Grafana middleware is executed before the reset.
Final thoughts
Love Hubot. Love Grafana v9 and all that comes with it. I think we've shown that with a bit of tinkering, you can make the software work for you.
Changelog
- Rewritten the article to include the code for the hubot-grafana project. Previous article can be found here: web.archive.org
- The regular expression is now case insensitive.
- Initial article