It is pretty easy to write your AWS ALB access logs to S3, but if you want to do something with them, add them to AWS Athena, so you could query them using plain old SQL. Let's investigate how we can see which upstreams / targets are misbehaving.
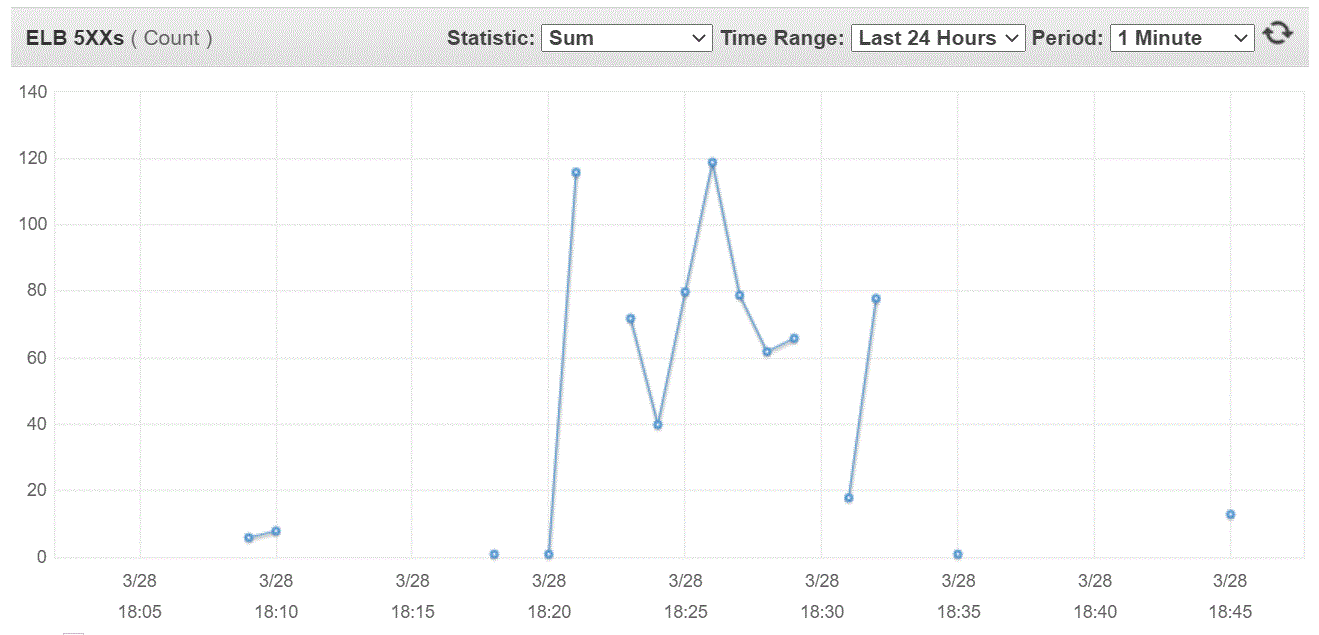
ELB 5XX?
We've noticed we got some ELB 5XX errors in our CloudWatch Monitor, but we were not sure what they were.
We've added the access logging to S3 and created a table in Athena using this guide.
Query unresponsive targets
Now, I've constructed a SQL query to query which shows the problematic targets. I define problem as the elb_status_code == HTTP 500 and the elb_status_code != target_status_code. This could indicate the ALB is no longer able to communicate with the upstream / target.
SELECT
  target,
  elb_status_code,
  count(*) AS request_count,
  min(time) AS mn,
  max(time) AS mx,
  date_diff('minute', min(time), max(time)) AS delta_in_minutes
FROM
  (
    SELECT
      target_ip || ':' || cast(target_port AS VARCHAR) AS target,
      from_iso8601_timestamp(time) AS time,
      elb_status_code
    FROM
      "default"."alb_logs"
    WHERE
      elb_status_code LIKE '5%'
      AND elb_status_code <> target_status_code
      AND time > '2021-03-28'
      AND time < '2021-03-29'
  )
GROUP BY
  target,
  elb_status_code
Note: I'm using a string-compare for time (I was kind of amazed that it works).
Note 2: The inner query can be used to extract all the timestamps of the failures.
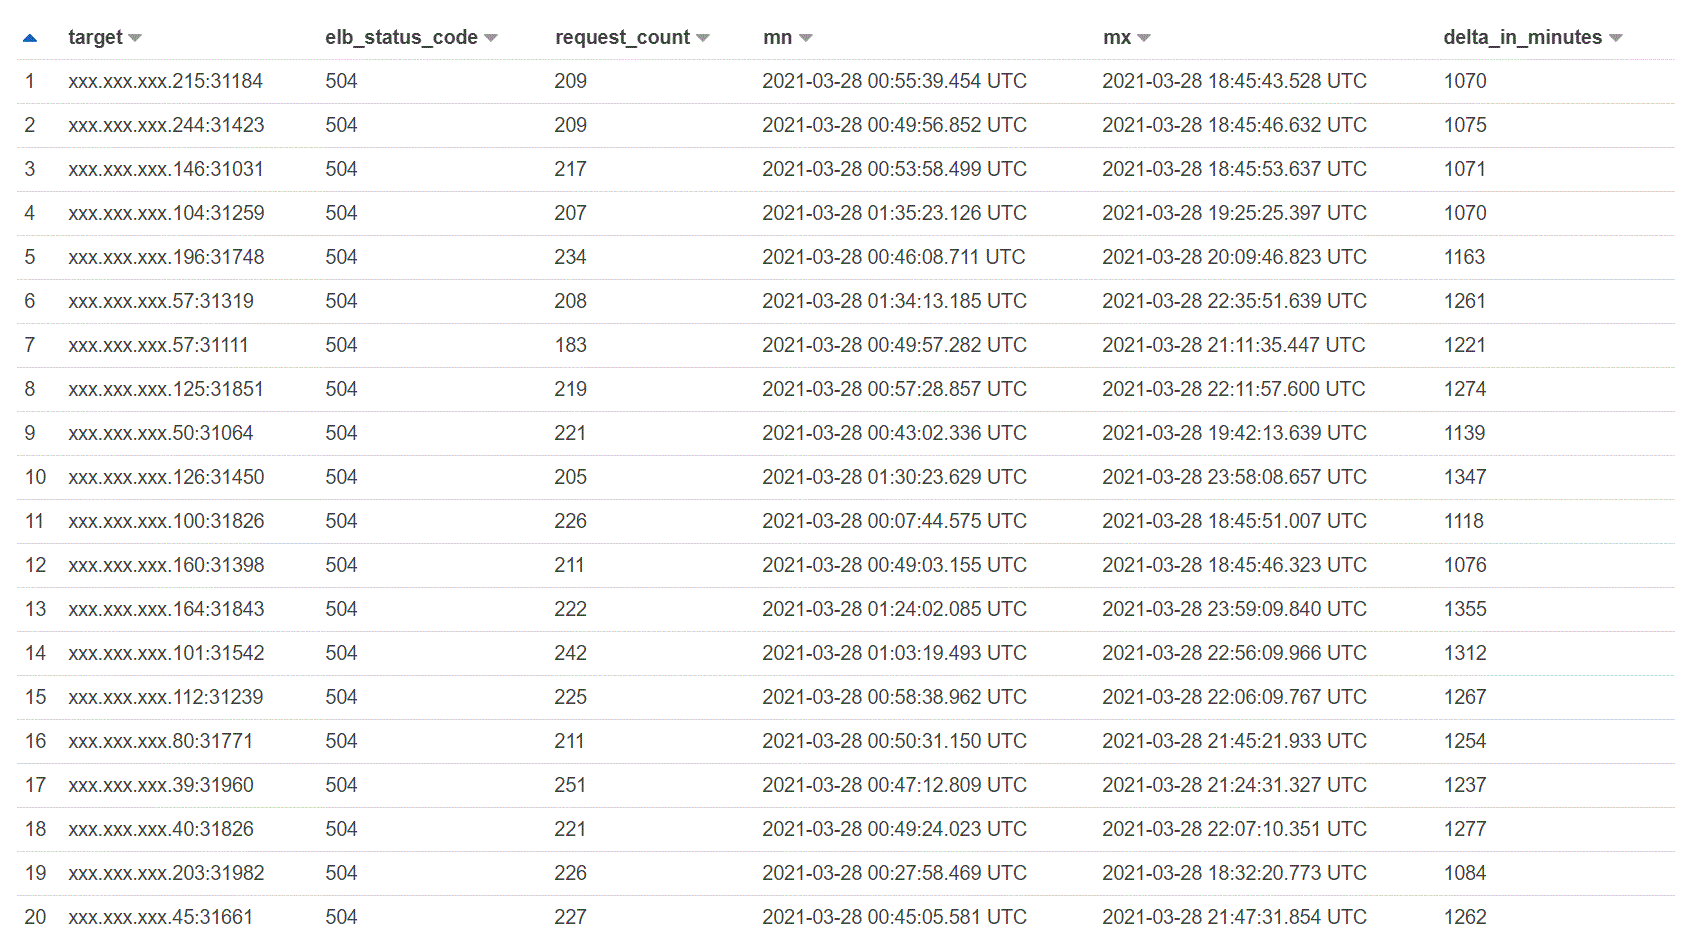
The result looks like this:

So, now we can investigate what those target machines were doing during those time frames.


