

Today we had a problem on the server: our app was causing the application pool to crash. Windows error reporting didn’t give a clear result of what was causing a stack overflow exception within the app. No stack-trace, no nothing. So how to solve a problem like this?
First check if more applications use the same application pool. Due to rapid fail protection, IIS will disable the entire application pool when crashes are to frequent, which might cause other applications to fail as well. Make sure your application runs on its own (isolated) application pool.
Next install Microsoft’s Debug Diagnostic Tool. This tool helps analyzing the problems.
The Debug Diagnostic Tool (DebugDiag) is designed to assist in troubleshooting issues such as hangs, slow performance, memory leaks or memory fragmentation, and crashes in any user-mode process.
You might need to uninstall a previous version. As far as I can see, no reboot is required. After installing, run the DebugDiag 2 Collection program (DebugDiag.Collection.exe). We’re going to use this program to capture the crash diagnostic events. It opens up in a wizard like this:
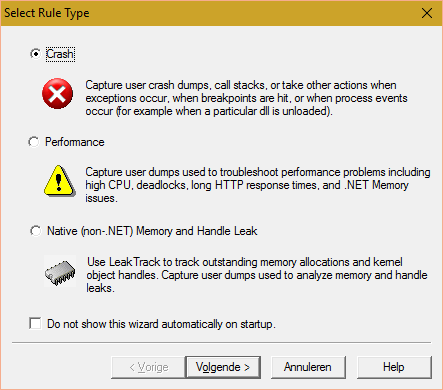
We’re investigating an application pool crash, so select the Crash rule type and click Next.
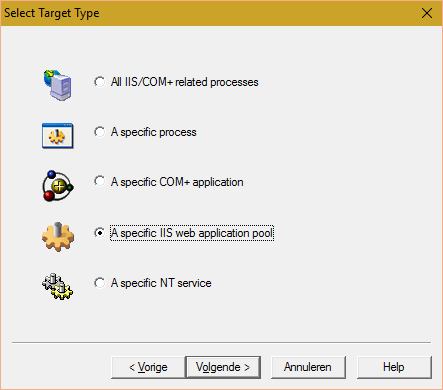
Next select as a target type A specific IIS web application pool and click Next.
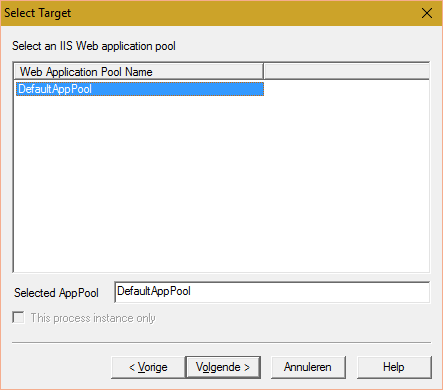
Select the application pool you need to investigate and press Next.
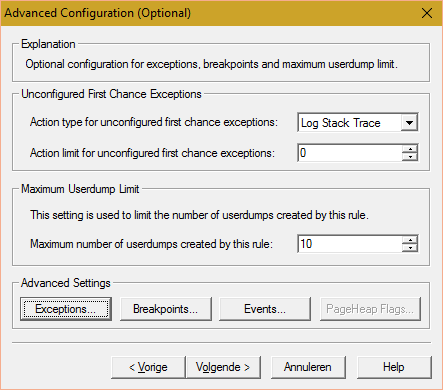
Change the Action type for unconfigured first chance exceptions to Log Stack Trace. This option should be sufficient to find the exception in the logging. If you cannot find the cause, change this option to do a full dump. The disadvantage of a full dump is the sheer volume of information (it might be way too much).
Click the button Exceptions and add the following thee exception from the list:
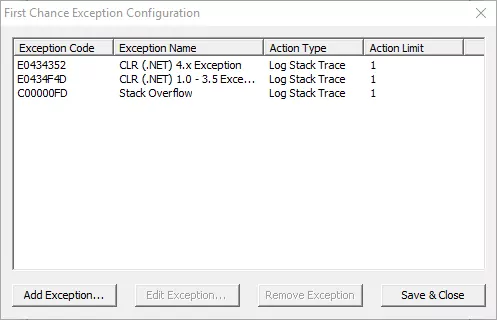
This will not only log the stack overflow, but also any unhanded .Net exceptions. Click Save & Close. And click Next.
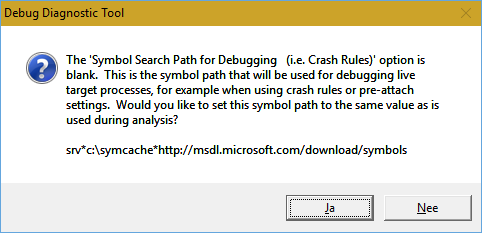
You’ll get the following scary looking message:
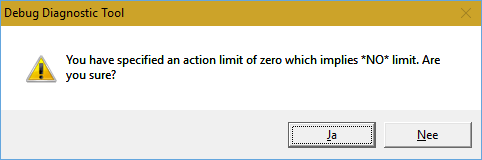
Because the application pool crashes, we’ll need all the logging we can get. Just make sure that you are the only one on the app, otherwise you'll need all day to spit through the logs. Due to rapid fail protection the pool will not cause many logs when you're the only one, so confirm the message.
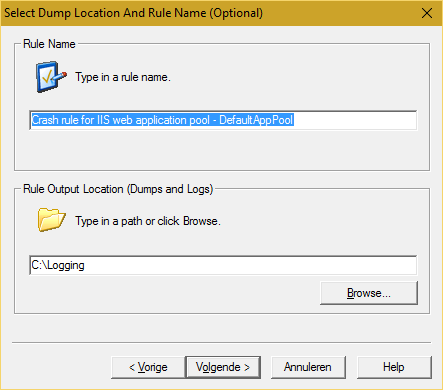
Specify a logging path and click Next.
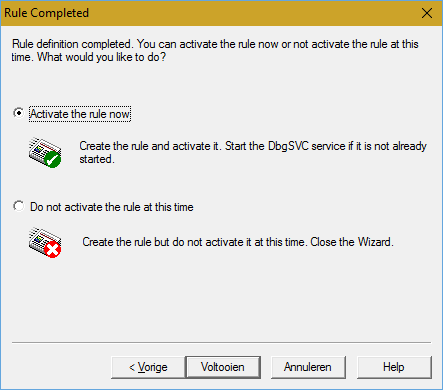
Click Activate the rule now and click Complete. Click Yes in the next dialog:
Debugging is now set up. Now you’ll need to do the following steps to start solving your problem:
- Open up the logging directory
- Open up IIS and restart the application pool
- Open up the application in the browser and make it crash
- Watch the log files come in
- Inspect the logs files
Hopefully this will give you an insight into the problem. Good luck debugging!